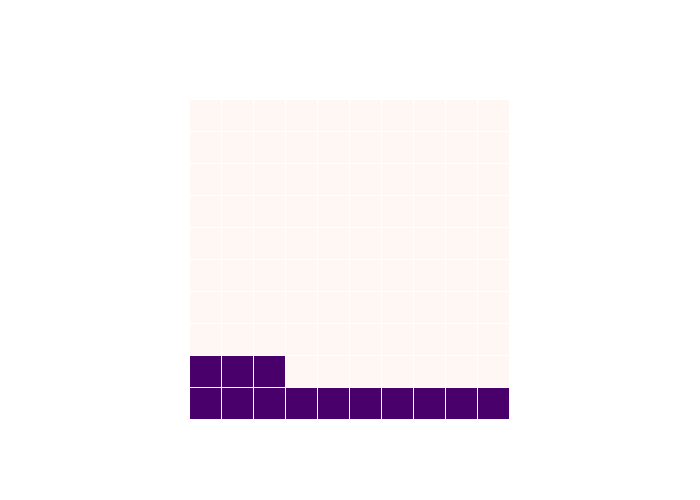
Waffleplots are somehow missing from many plotting libraries, so here we go:
import numpy as np
import plotly.graph_objects as go

def plot_waffle_plot(v=1, dims=(10,10)):
    """ Plot Waffle plot with dimensions of *dim* and value v
    Args:
        v (int): value
        dims (Tuple[int, int]): dimensions of the waffle
    """
    z = np.zeros(dims)
    z.reshape(-1)[:v] = 1
    fig = go.Figure(go.Heatmap(
        x=[i for i in range(1, 10)], y=[i for i in range(1, 10)], z=z,
        xgap=1, ygap=1,
        colorscale=[[0.0, '#FFF7F3'],
                [1.0, "#49006A"]],
        showscale=False
    ))
    fig.update_layout(yaxis = dict(scaleanchor = 'x'))
    fig.update_layout(plot_bgcolor='rgba(0,0,0,0)')
    fig.update_yaxes(showticklabels=False)
    fig.update_xaxes(showticklabels=False)
    fig.show()

plot_waffle_plot(13)