Looking at the activations and gradients of your model -especially their evolution over time - makes up for a good debugging tool.
import torch
from torch import nn
from torch.functional import F as TF
import plotly.figure_factory as ff
import numpy as np
class MyModel(nn.Module):
def __init__(self):
super(MyModel, self).__init__()
self.cl1 = nn.Linear(25, 60)
self.cl2 = nn.Linear(60, 16)
self.fc1 = nn.Linear(16, 120)
self.fc2 = nn.Linear(120, 84)
self.fc3 = nn.Linear(84, 10)
def forward(self, x):
x = TF.relu(self.cl1(x))
x = TF.relu(self.cl2(x))
x = TF.relu(self.fc1(x))
x = TF.relu(self.fc2(x))
x = TF.log_softmax(self.fc3(x), dim=1)
return x
activation = {}
def get_activation(name):
def hook(model, input, output):
activation[name] = output.detach()
return hook
gradient = {}
def get_gradient(name):
def hook(model, grad_input, grad_output):
gradient[name] = grad_output[0].detach()
return hook
model = MyModel()
for k, v in model.named_modules():
if k != "":
getattr(model, k).register_forward_hook(get_activation(k))
for k, v in model.named_modules():
if k != "":
getattr(model, k).register_backward_hook(get_gradient(k))
out = model.forward(torch.rand(1, 25))
loss = torch.nn.MSELoss()
y = torch.rand(1, 10)
l = loss(y, out)
l.backward()
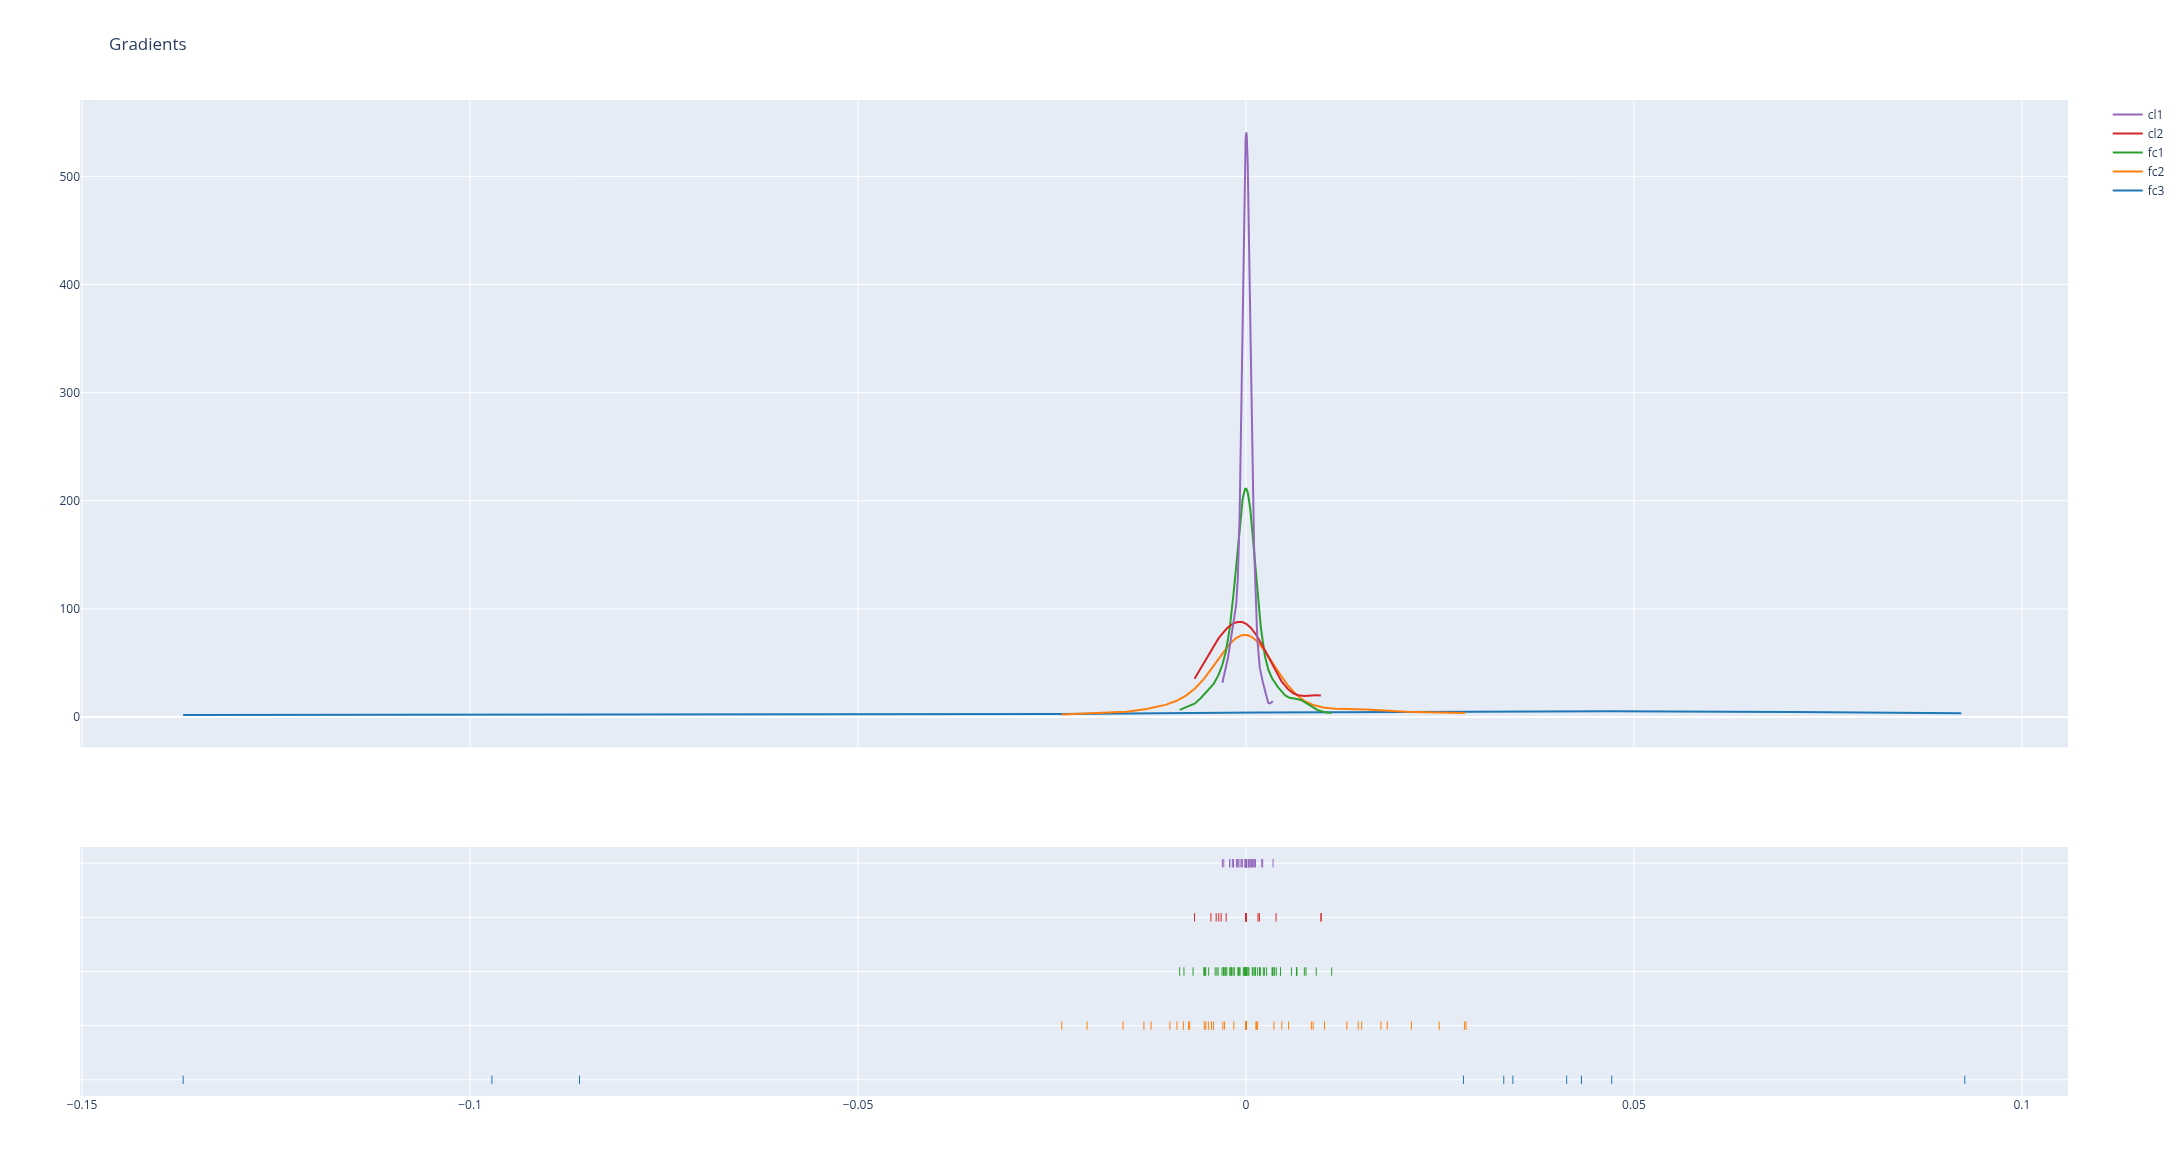
hist_data = [gradient[k].numpy().flatten() for k in list(gradient.keys())]
group_labels = [k for k in list(gradient.keys())]
fig = ff.create_distplot(hist_data, group_labels, show_hist=False)
fig.update_layout(title_text='Gradients')
fig.show()
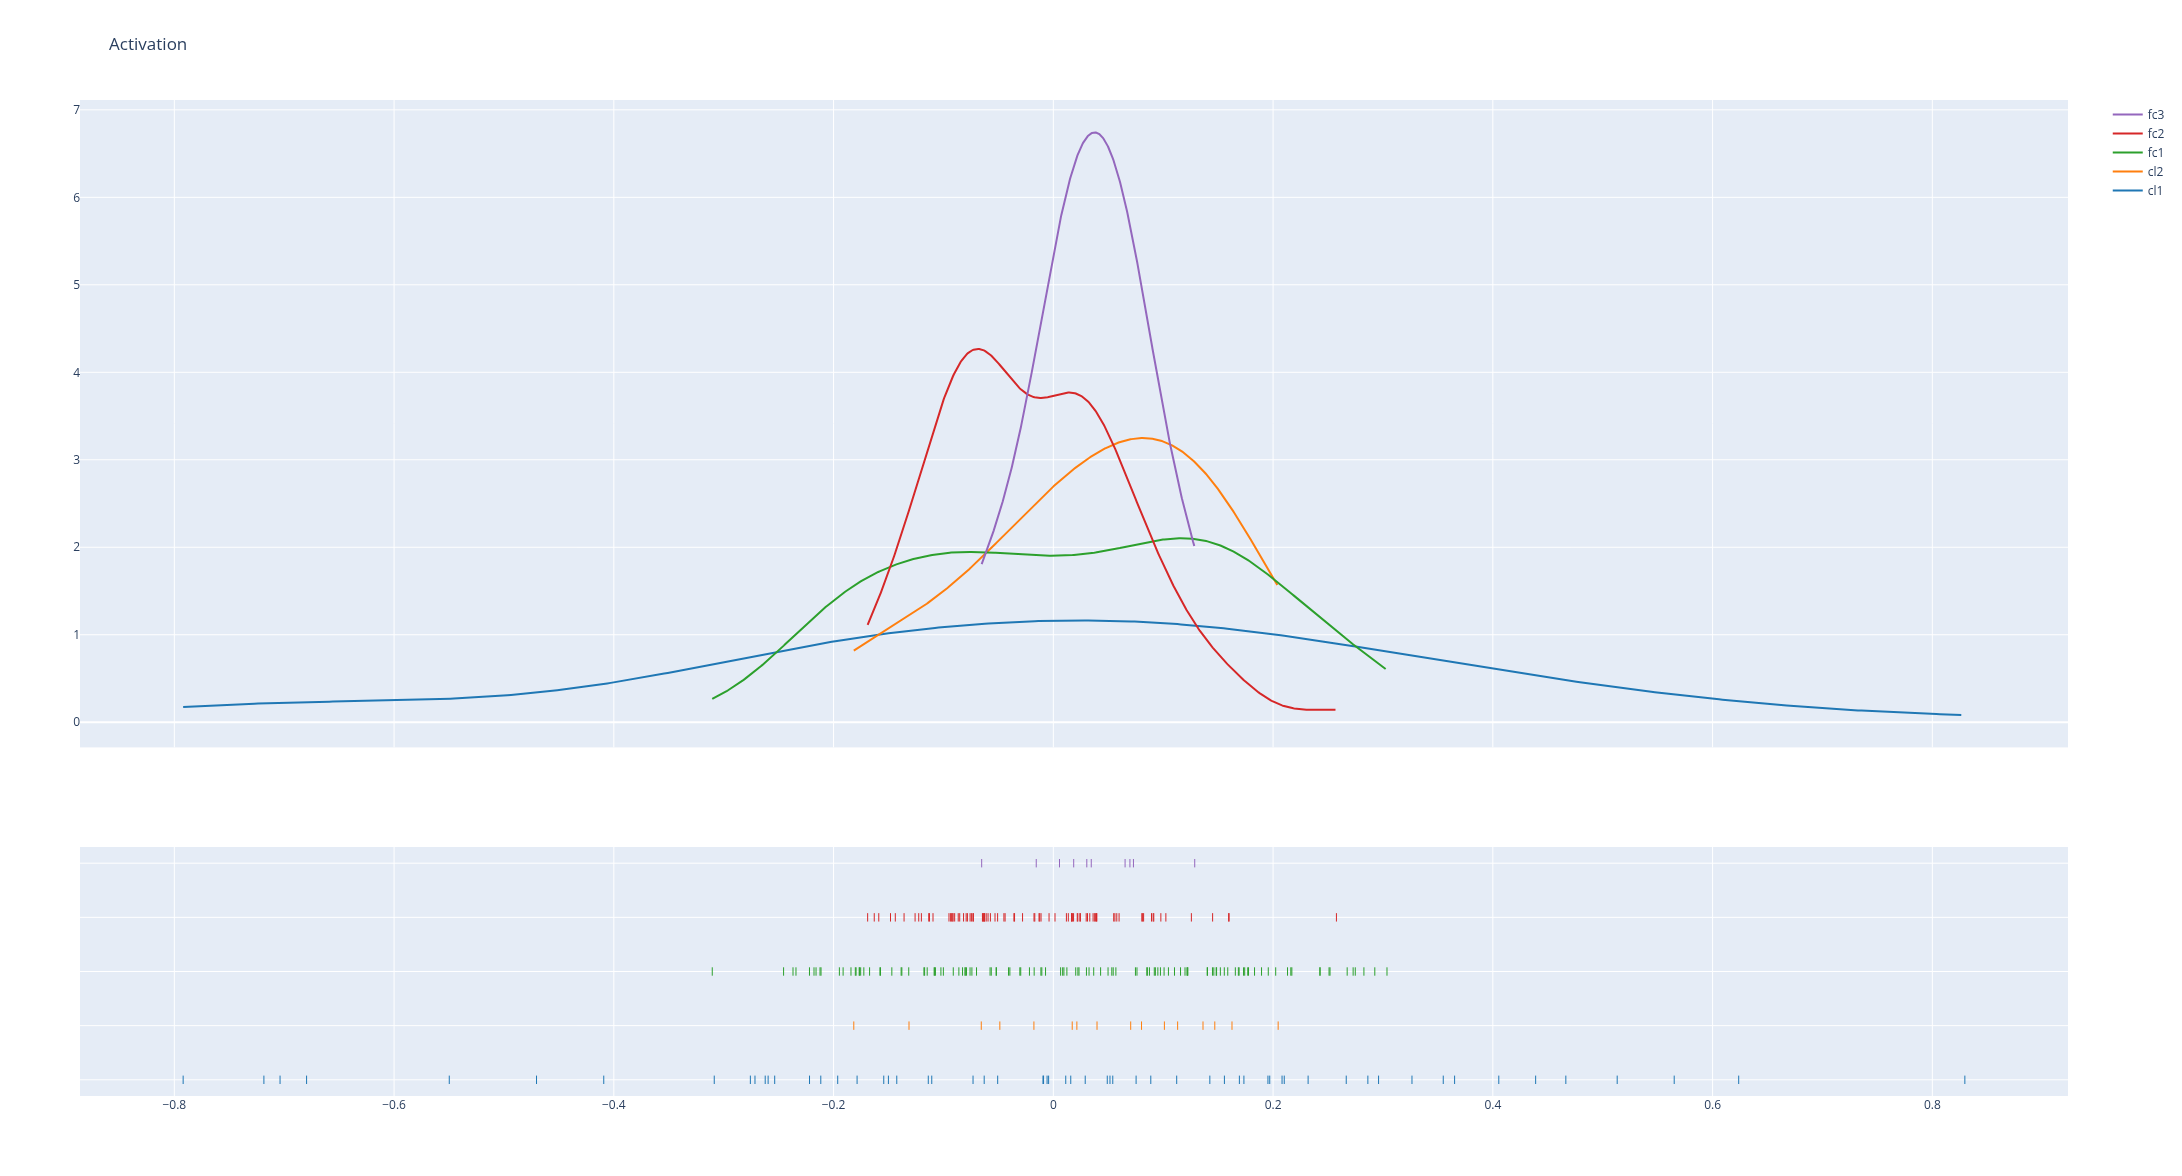
hist_data = [activation[k].numpy().flatten() for k in list(activation.keys())]
group_labels = [k for k in list(activation.keys())]
fig = ff.create_distplot(hist_data, group_labels, show_hist=False)
fig.update_layout(title_text='Activation')
fig.show()